Strategy, Systems Thinking, and Being Wrong


After a company achieves product/market-fit, things get complex.
Business complexity compounds with the expansion of the customer base, code base, and team. Developing a strategy at this stage requires systems thinking. To make forward progress, you must find leverage points. Donella Meadows writes:
Folks who do systems analysis have a great belief in “leverage points.” These are places within a complex system (a corporation, an economy, a living body, a city, an ecosystem) where a small shift in one thing can produce big changes in everything.
A difference between the top companies and the rest of the pack is that they think in terms of leverage points.
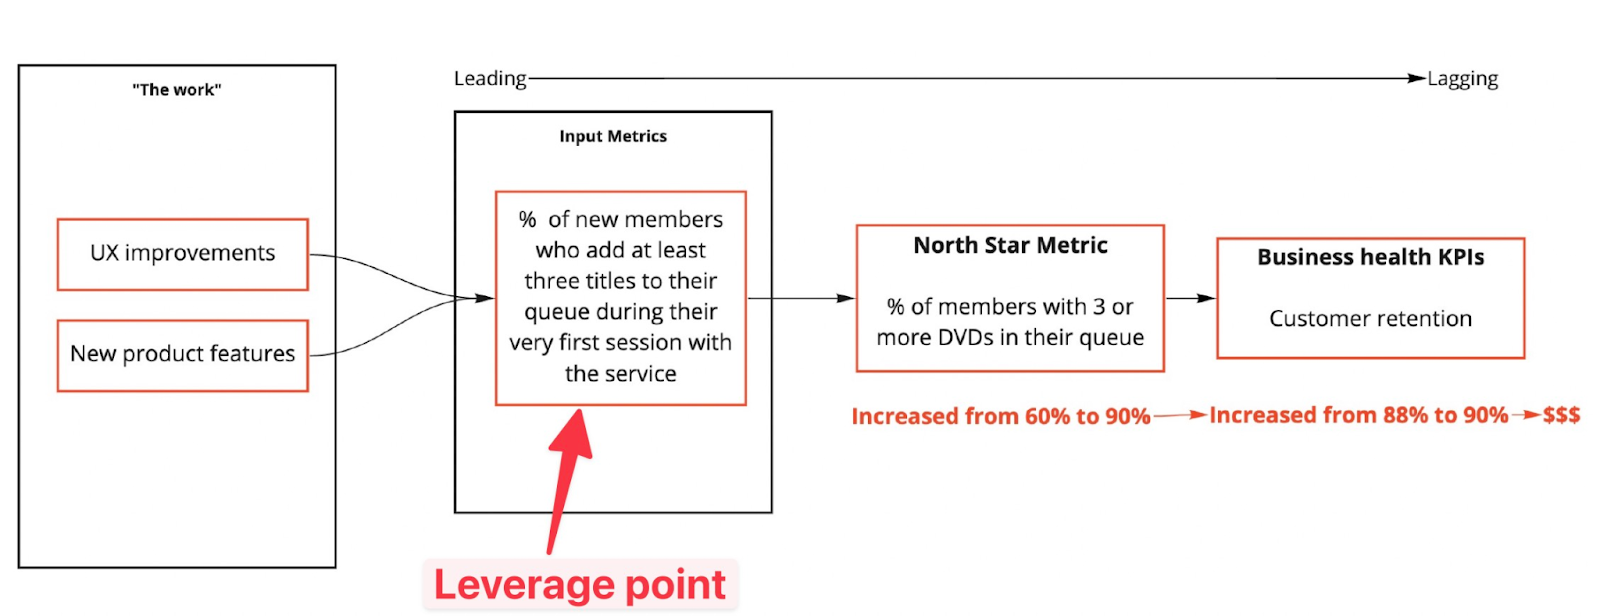
A classic example is how Netflix improved retention rates when they were a DVD business. Complex factors lead customers to stay or churn. But Netflix identified a key lever: the number of DVDs that customers add to their queue in their first session on Netflix. By focusing product improvements on this leverage point, they were able to have a big impact on their business as a whole.
Finding the leverage points in a business is hard. Intuition plays a large role in getting startups to product/market fit. However, post-product/market-fit, intuitions can be dangerously misleading. Complex systems are deeply counterintuitive. According to Meadows:
Leverage points are not intuitive. Or if they are, we intuitively use them backward, systematically worsening whatever problems we are trying to solve.
At DoubleLoop, we’ve seen our customers discover that they were spending millions on initiatives that were hurting their business.
“Strategy” is a fuzzy concept that is prone to bullshit. But for companies that are post-product/market-fit, there is an insanely exciting opportunity to make strategy more scientific.
According to the philosopher Karl Popper, the defining characteristic of science is that it’s falsifiable. "Strategy" can mean lots of things. But there's an opportunity to inform strategy with scientific models of how a business operates; a set of hypotheses that you can test, invalidate and iterate on.
For post-product/market fit companies, strategy is based on a theory of relationships between work and metrics; a model that hypothesizes answers to these questions:
- What are the lead measures (leverage points) of the critical business KPIs?
- What projects can influence these lead measures?
A company’s first attempt to answer these questions will inevitably miss the mark. Iteration makes your metrics-driven strategy stronger and stronger. It requires placing bets and running experiments to hone in on a model that works.
Unfortunately, at most companies, models of how the business functions are buried in the minds of few, untested, and ill-expressed. Consequently, the artifacts that commonly masquerade as a strategy (e.g., roadmaps, OKRs) live on shaky ground. See my previous post, OKRs ≠ Strategy.
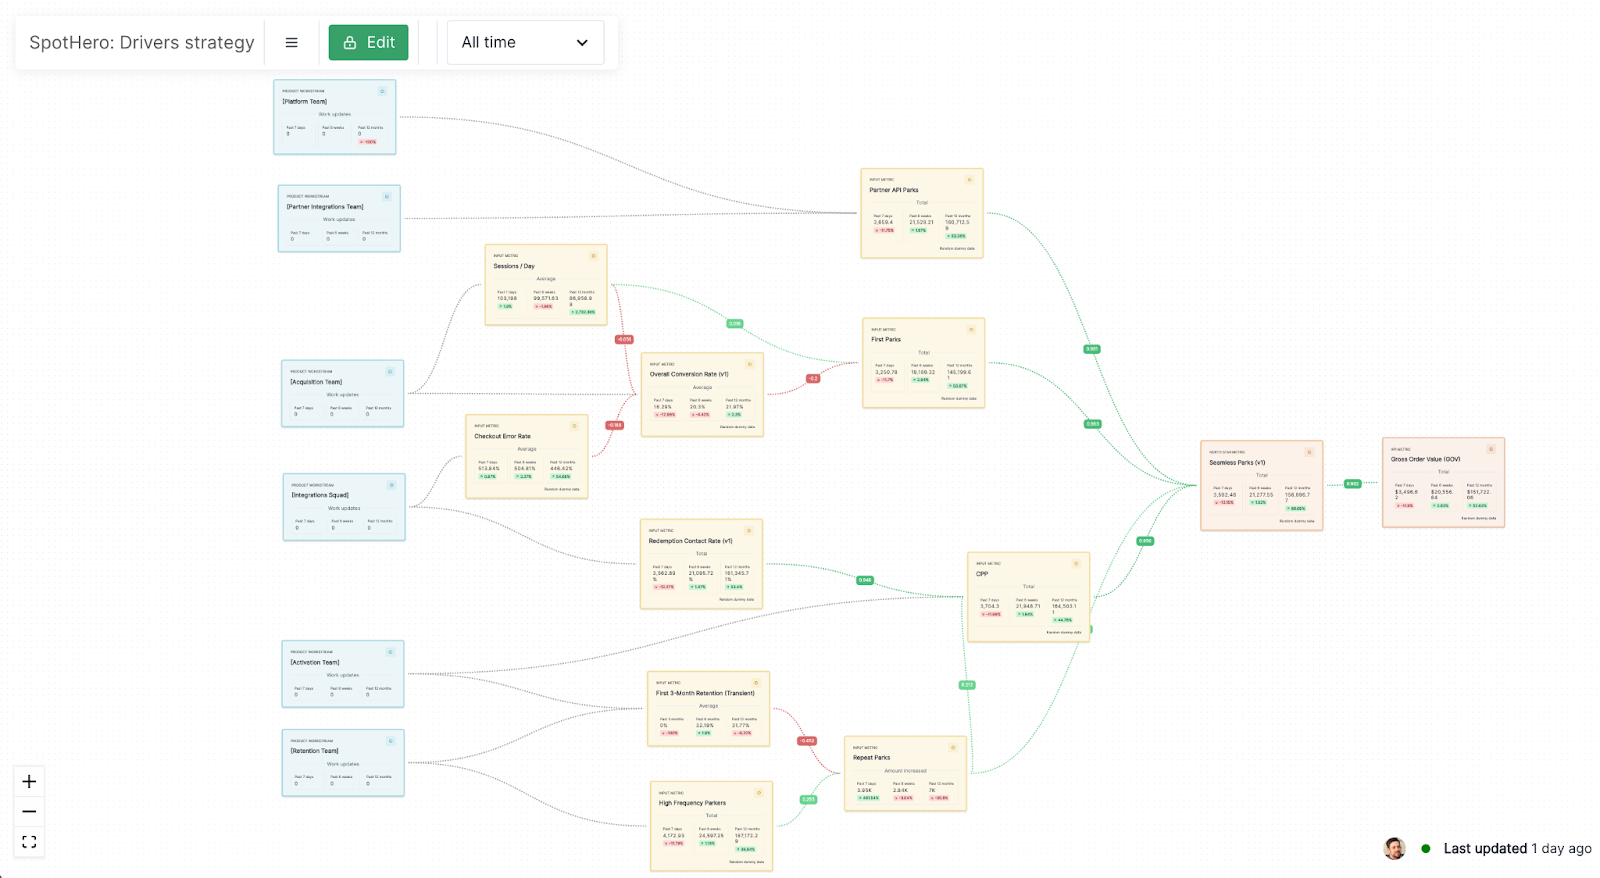
At DoubleLoop, we’ve had the privilege to watch a growing number of companies take a scientific disposition toward their strategy. Regan Davis, a product leader at SpotHero, is at the forefront. SpotHero is a marketplace that connects parking facilities with drivers to make it easier to secure parking. When they modeled the driver-side of their strategy in DoubleLoop, it looked like the below screenshot.
Regan and I talked in-depth about what he learned from mapping their strategy in DoubleLoop.
A few themes emerged.
1. Front-line contributors are happier when they have the business context.
At the peak of remote work during Covid, frontline contributors at SpotHero felt disconnected from why their work mattered to customers. But after they mapped the strategy, people got happier, according to an internal survey. Each blue box in the above map represents the work of a particular product squad. The map shows how each initiative ladders up to the North Star metric and business KPIs. It became clear why everyone’s work mattered in the big picture of the business.
2. Building confidence in your North Star metric requires evidence.
Companies rally around North Star metrics to ground themselves in customer value instead of just revenue. It’s a recipe for long-term success. However, the adoption of a North Star metric can fail if team members don’t feel confident that their North Star metric is predictive of business success.
After SpotHero mapped its strategy in DoubleLoop, Regan connected metrics on their map to their data warehouse, via the DoubleLoop Looker integration. The correlation scores generated by DoubleLoop confirmed that their North Star metric “Seamless Parks” was strongly correlated with their key business KPI, “Gross Order Value.” See the screenshot below.
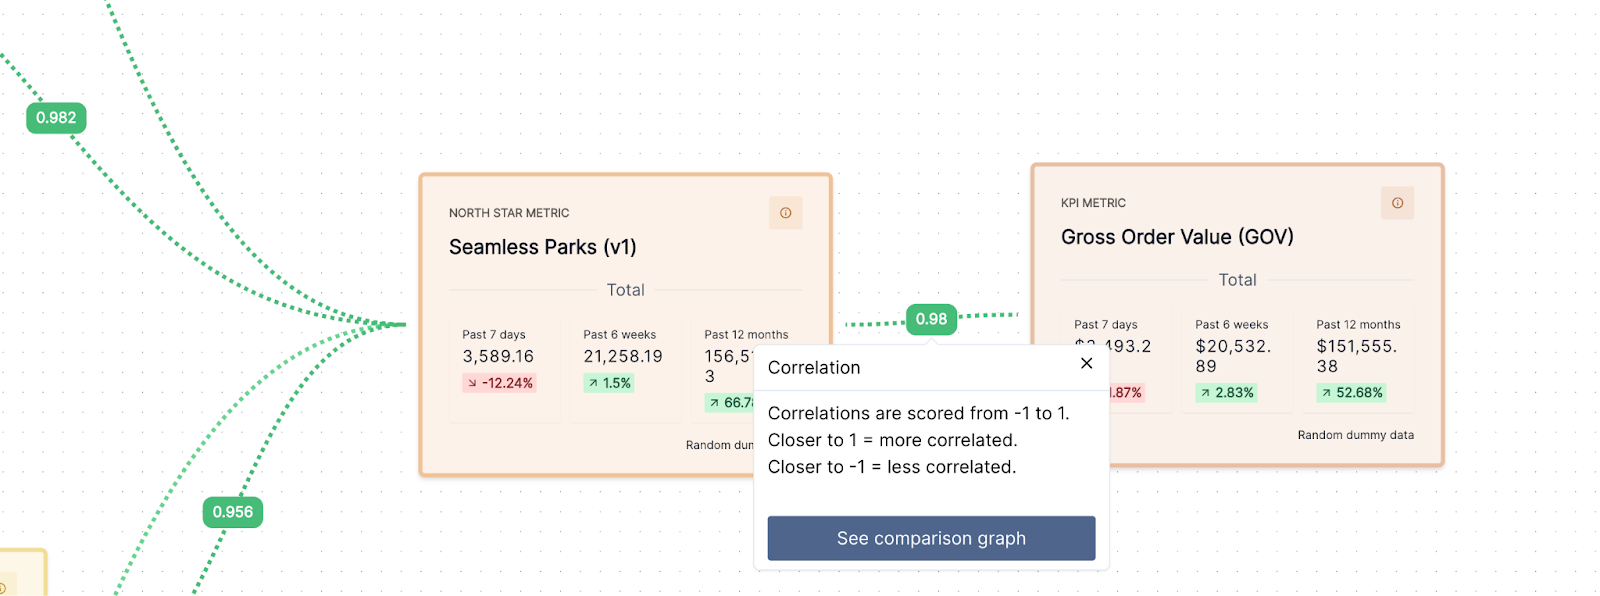
Some folks had previously been skeptical that “Seamless Parks” was the right North Star metric for SpotHero. Seeing the positive correlation in DoubleLoop alleviated these concerns and allowed the team to rally around their North Star metric without hesitation.
3. Wins can be squandered without cross-functional alignment.
The product team at SpotHero released a feature that improved the results for parking facilities in their marketplace. When looking at their data-connected map in DoubleLoop, Regan was surprised to see that utilization per seller had not expanded as a result of this improvement.
Regan discovered he had made a false assumption. Yes, the product features had correctly shown great results for parking facilities. But utilization wasn't organically increasing -- instead, the opposite was happening.
After that discovery, the product and sales team had critical conversations about the company strategy and how they could work together to boost the impact of each others' good work
4. Assumptions about leverage points can surprisingly prove false.
To make their North Star metric actionable, SpotHero identified input metrics that were intended to (1) be predictive of their North Star metric and (2) influenceable with projects. These input metrics represented what they believed were the leverage points in the complex system of their business. However, the correlation scores in DoubleLoop revealed that some of their assumptions were wrong.
For example, the product team assumed that “First 3-Month Retention” was predictive of “Repeat Parks.” But it turned out that the metrics were inversely correlated, as shown below.
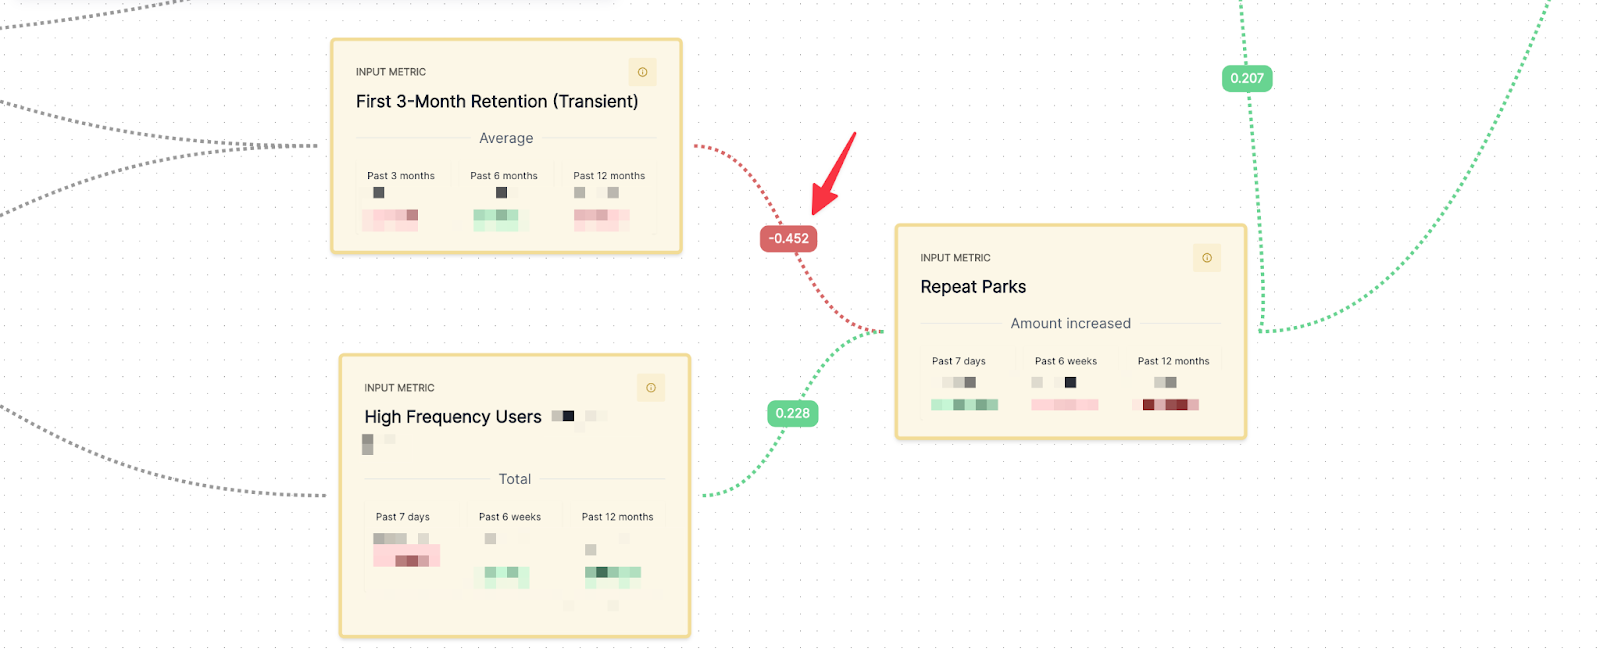
When they looked at the metric comparison page in DoubleLoop, it looked like the metrics were moving in opposite directions. It appeared that 3-month retention was not the right lever to move repeat parks, and this provoked SpotHero to reevaluate its strategy.
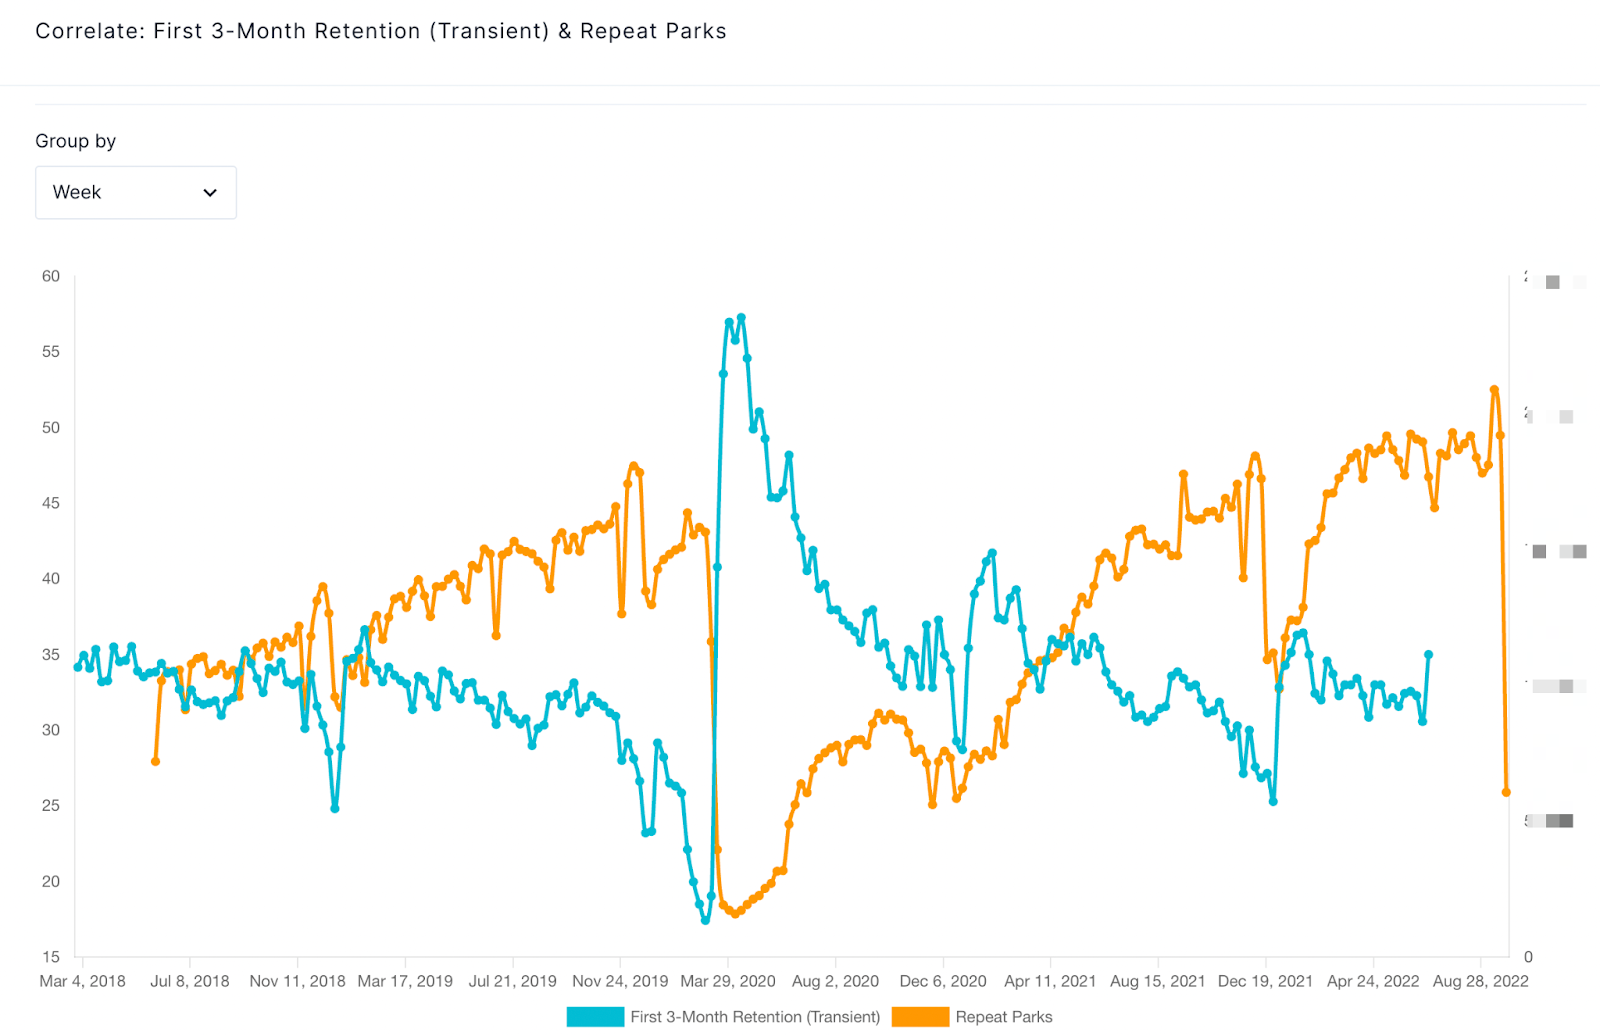
It’s important to note that changes in the market can change how your business functions. Since the impact of Covid has calmed down, SpotHero is now seeing a positive correlation between these metrics, if they account for a 90 lag, which DoubleLoop allows you to do. Strategies need to be routinely tested over time.
5. System thinkers need to simplify how they communicate.
John Cutler’s advice for systems thinkers resonated with Regan:
Keep in mind that you don’t have share all of your work… Your default description of (almost) any problem will be too threatening/overwhelming.
For this reason, Regan made a simpler version of his strategy map to share with the executive team. It shows how every department contributes to the key levers that drive the business.
Thank you to Travis Brooks, John Cutler, Casey Winters, and Matthew David for providing feedback on earlier drafts of this article.
If you’d like to model the complex system of your business, signup for DoubleLoop and let us know how we can help.
Here’s a 5-min demo of DoubleLoop: