Metrics-driven product development is hard.

The way that the FAANG companies use metrics to build products is vital to their success. They invest an army of people and homegrown tools to pull it off. My last article, Balancing short-term and long-term product bets, describes Google's process.
While the very top companies are great at using metrics, after talking to the hundreds of PMs who signed up for DoubleLoop, I’ve learned that almost everyone else is struggling.
Myself included. In my 15 years of product management experience, working for companies from big to small, effectively using metrics was painfully hard every time.
There are many ways for a metrics-driven process to go astray.
For a lot of teams, getting visibility into the metrics that matter is elusive by itself. Instrumenting new metrics takes work that tends to slip in priority.
But even teams who successfully create a library of valuable metrics are not out of the woods. They are left with the question: what do we do with all the data at our fingertips?
The answer, presumably, is that you can use the data to do better work and build better products. This is easier said than done. Teams risk two primary pathologies that I’ve personally suffered from multiple times:
- Nearsightedness. The team is skilled at moving sensitive metrics, but their optimizations don’t translate to long-term business success. Or worse, while they optimize one set of metrics, other important metrics go in the wrong direction.
- Farsightedness. The team monitors metrics tied to their company’s long-term business success, but they’re unable to see how their work can move the metrics that matter. Consequently, they place product bets without a precise thesis for creating measurable impact.
“Good vision,” in the product development sense, is the capacity to make short-term bets that compound to create long-term business value.
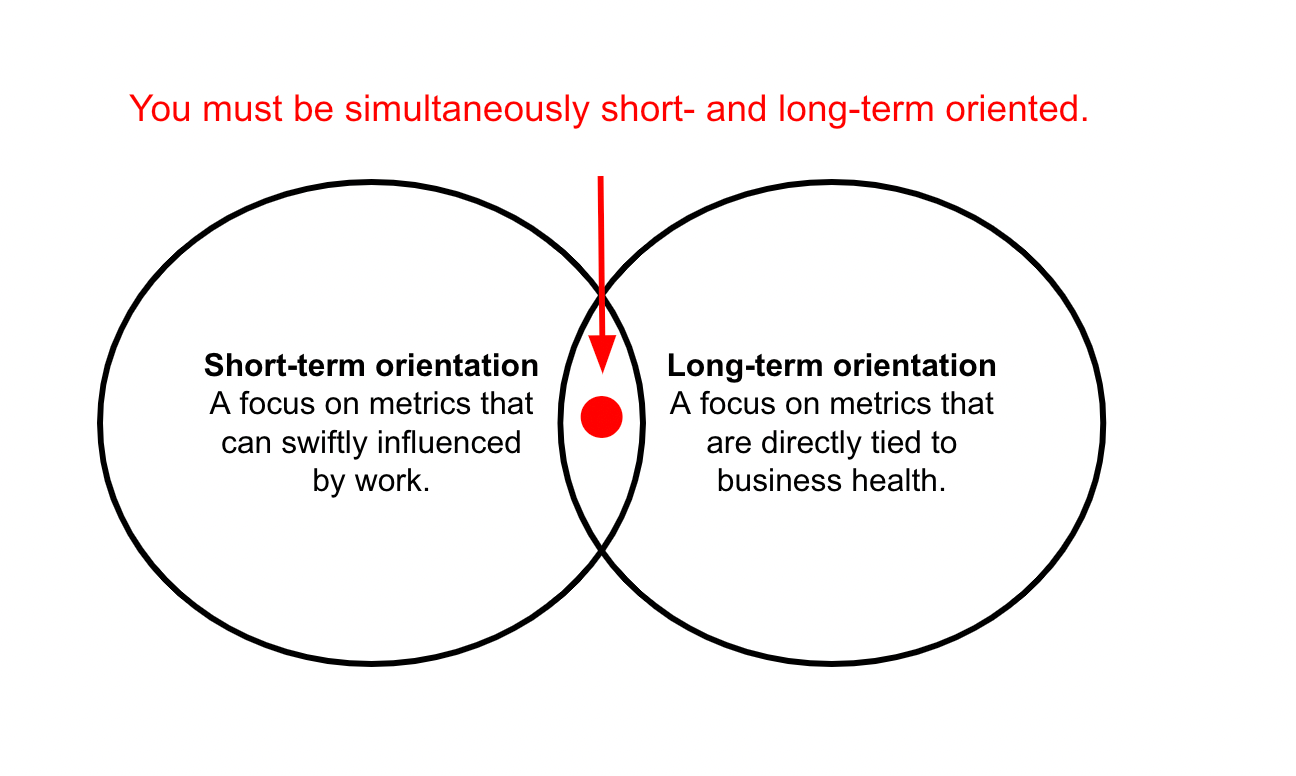
It might seem paradoxically hard to be simultaneously short-term and long-term oriented, but this is exactly what the world’s top companies do. The way they do it follows the same pattern.
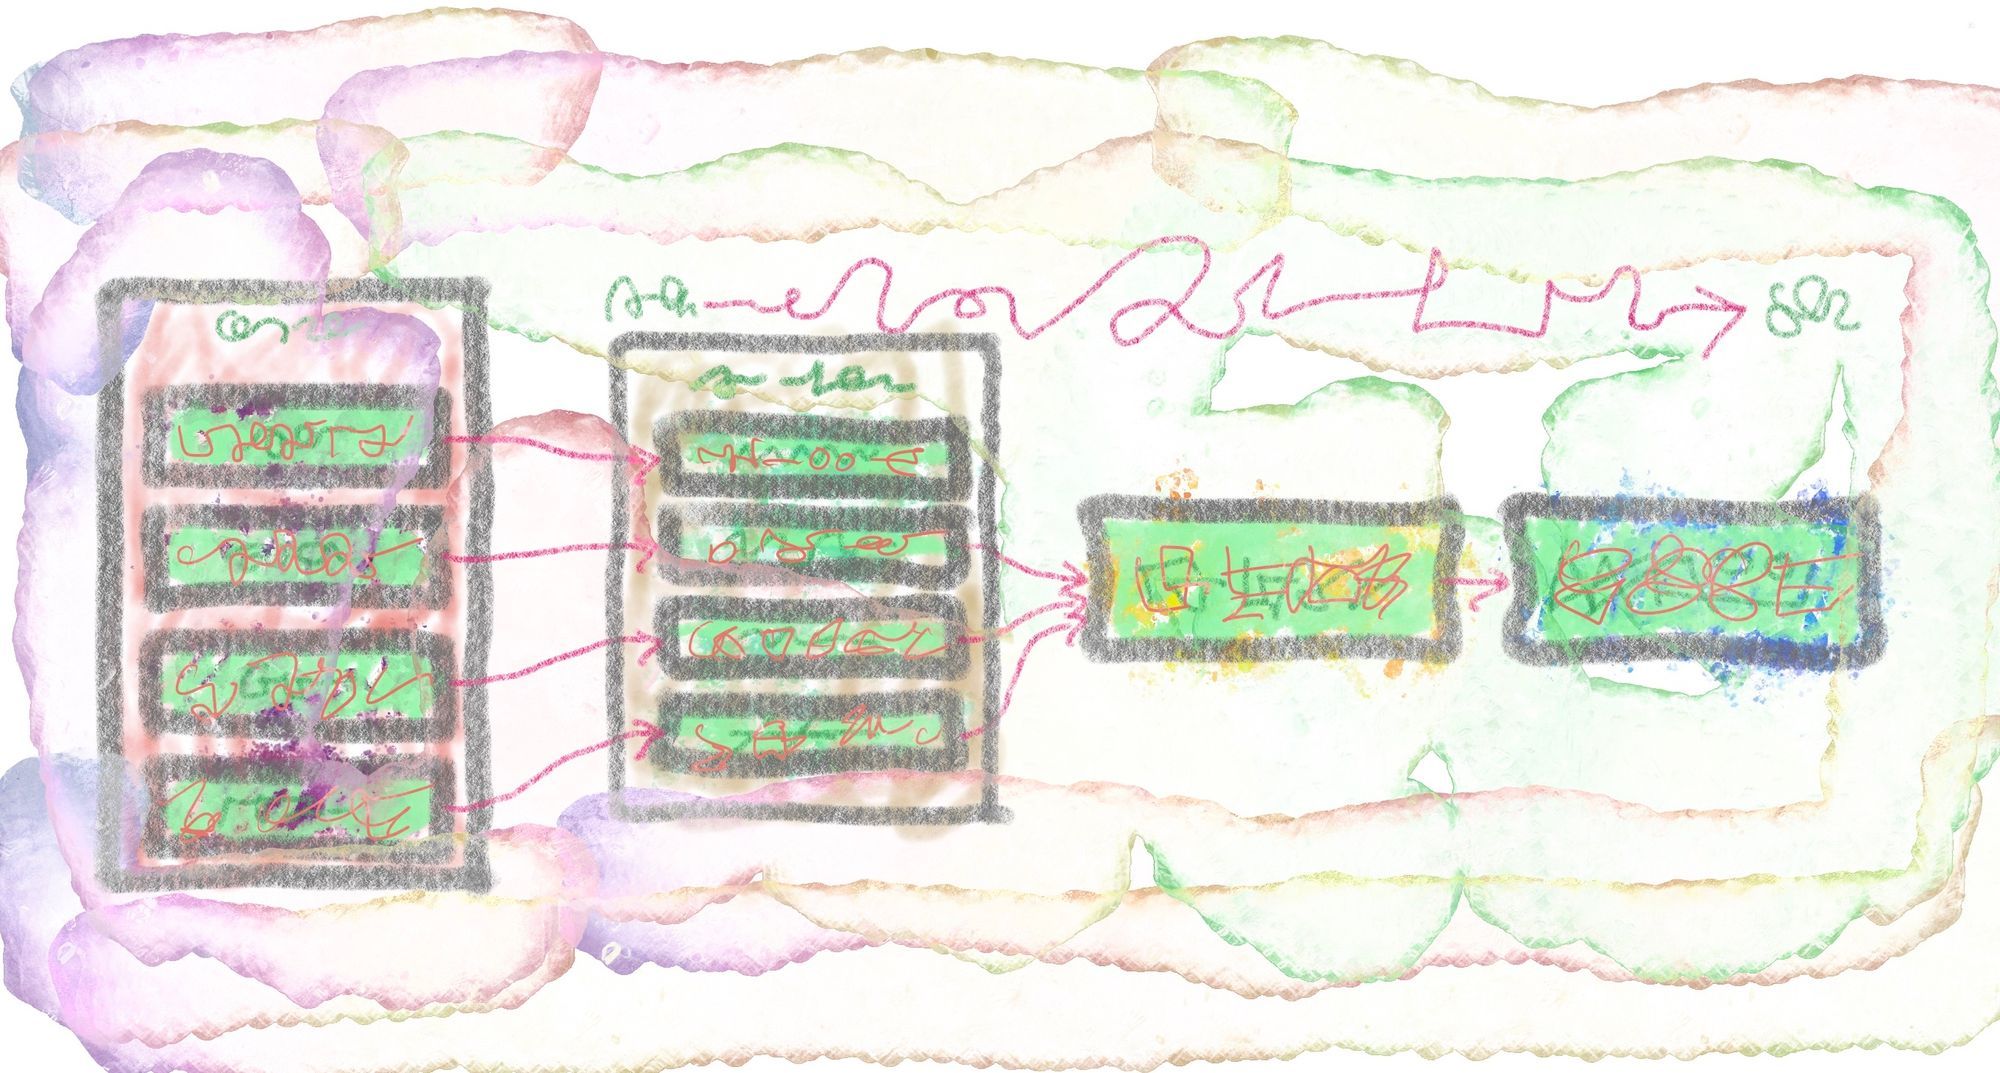
There’s a shared structure to how product teams at the top companies get business results. It looks like this:

While each company has its own vocabulary, I’ve found that Amplitude’s North Star Playbook by John Cutler and Jason Scherschligt provides an excellent synthesis. I get reliable head nodding when I’ve shared the above visual with PMs at companies like Google, Facebook, Netflix, Square, and Uber.
A key element of the visual model is that the metrics are arranged on a spectrum from “leading” to “lagging.” Leading indicators are sensitive. You can make a change and quickly see leading indicators go up or down. Lagging indicators, in contrast, are slow to move. They’re subject to things outside of your control like macroeconomic forces, seasonality, or pandemics. You can influence lagging indicators, but it takes time and patience.
There are two sides to the brutal reality of metrics-driven product development:
- Lagging indicators are the KPIs that actually matter for your business; things like revenue and customer retention. Because they are lagging and subject to external forces, product teams often feel helpless in impacting them.
- Leading indicators can be influenced by work, like the percent of users that perform a certain action during a session. By themselves, they don’t equate business success. Impacting them feels more like local optimizations than game-changing breakthroughs. And they’re subject to being “gamed” or manipulated if they’re poorly conceived or handled.
Your North Star metric is the antidote. It’s the bridge between your leading and lagging indicators. A good North Star metric will align your team around creating differentiated customer and business value. It expresses your product strategy.
For example, Amplitude’s own North Star metric is Weekly Learning Users (WLUs), “the count of active Amplitude users who have shared a learning that is consumed by at least two other people in the previous seven days." They explain:
This North Star represents Amplitude’s most valuable user persona, the Advocate, who shares context to drive decisions and take action in an organization. Amplitude’s product strategy is to be learning-driven, providing insights to cross-functional teams. WLUs represent this strategy.
Another educational example is how Netflix applied the North Star framework to increase customer retention when they were a DVD business. Since customer retention is a lagging indicator that is difficult to swiftly impact with product work, they created a more sensitive North Star metric. Gibson Biddle, the former VP of Product for Netflix, is quoted in the North Star Playbook:
“At Netflix, we knew that improving retention was the critical metric to improve—it would improve both customer and shareholder value. But retention is very hard to move and A/B tests for retention require lots of time to see a meaningful difference," said Gibson. "So we developed more sensitive proxy metrics. Our ‘Percentage of new members who add at least three titles to their queue during their very first session with the service’ is a good example."
Seeing the above visual model of the North Star Playbook is both anxiety-relieving and anxiety-inducing at the same time. When I first saw it, it felt cathartic to see a clear picture of how metrics-driven product development works. But it also illustrates the complexity of executing it.
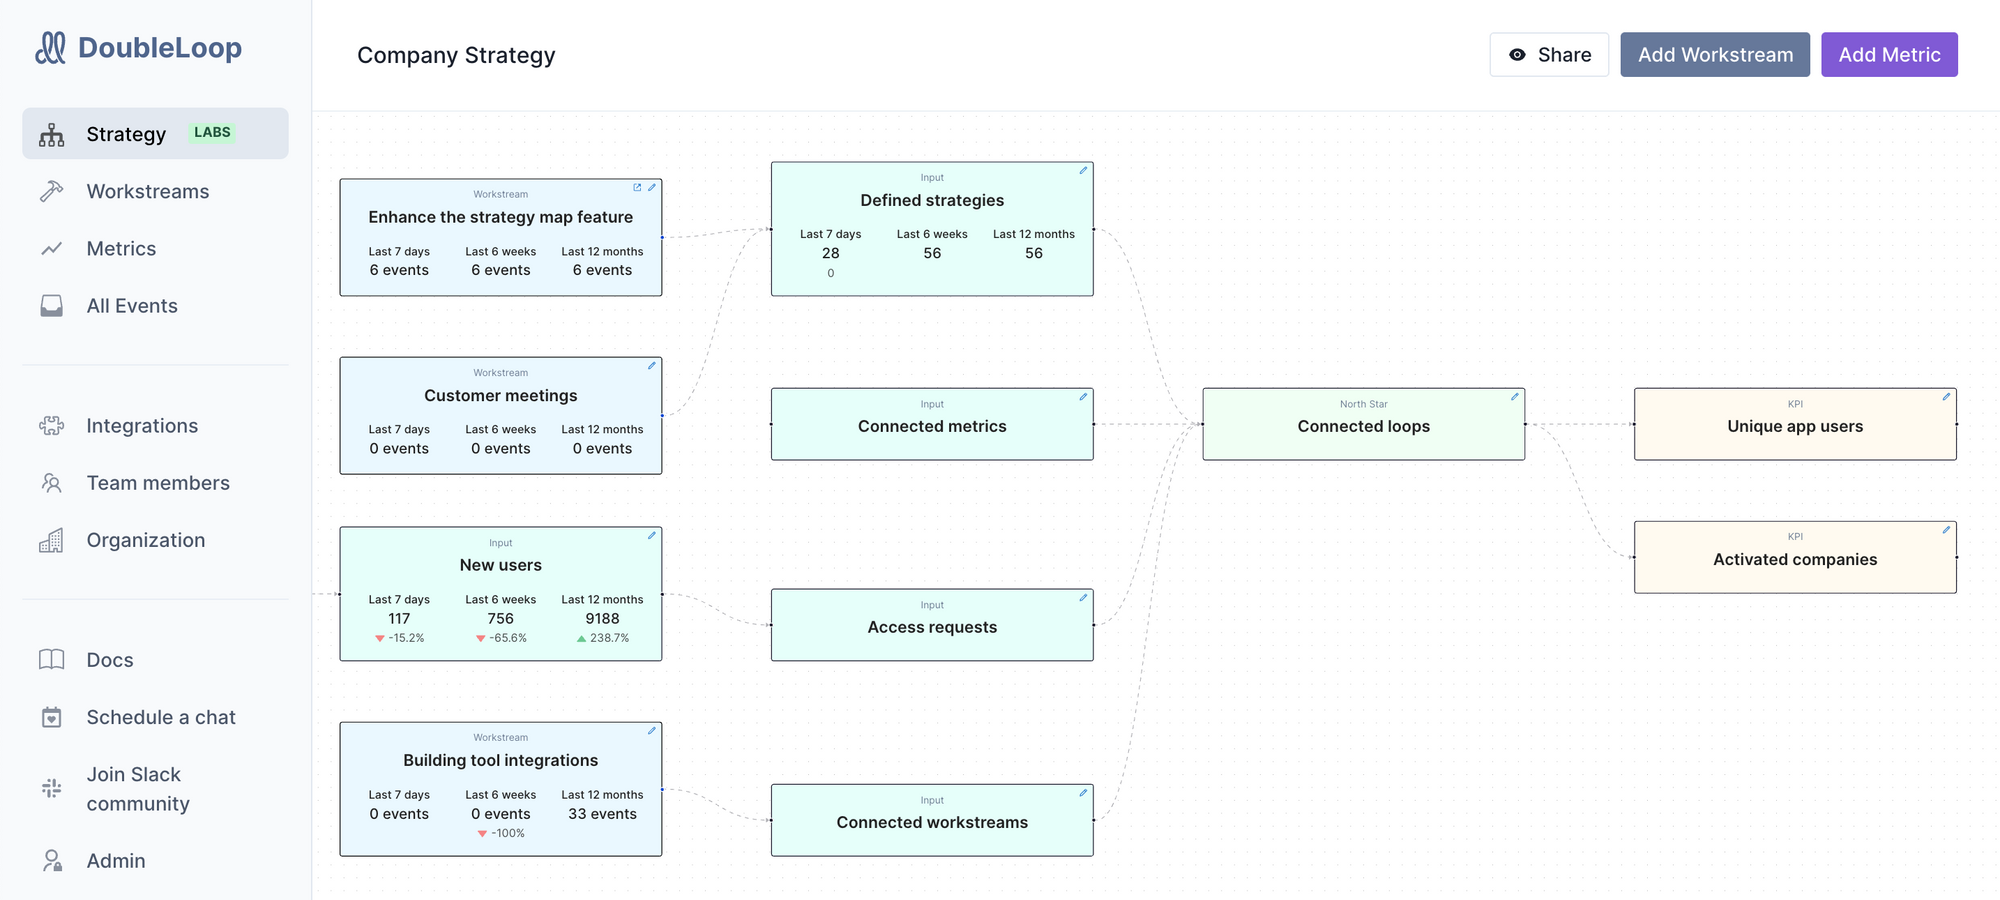
To tie work to business results, you must create a graph of relationships between work and metrics.
E.g., “If we optimize X in the product, then metric Y will go up. If metric Y goes up, then that improves our North Star metric. And if we increase our North Star metric, the business will make more money.”
Here’s how we use the new strategy diagramming tool in DoubleLoop to build our own graph of work and metrics:
Each link in the graph is an assumption that could be wrong or go wrong. You can form hypotheses for how work will move input metrics and for how leading indicators influence lagging indicators. But your hypotheses, of course, can prove false. And a correlation that exists at one point in time might break in the future.
Thus, your map of relationships between work and metrics must be dynamic, not static. When an initiative succeeds or fails, your strategy must be adjusted. When the market changes it must be adjusted. When your North Star metric fails to correlate with your business KPIs, it must be adjusted.
Adjustments can range from big to small. In some cases, a nuanced recalculation of a metric suffices. In other cases, the premise of a metric or initiative must completely change, or the graph of relationships must be reorganized.
Each change has rippling effects. If you tweak your North Star metric, all upstream indicators and initiatives might need to shift as well. One branch of your strategy might stay fixed for quarters while another branch needs constant attention.
Metrics-driven product development is hard and will always be hard. But there's a lot to be done to make it easier.
We’re building DoubleLoop to be your system-of-record of the relationships between your work and metrics. DoubleLoop enables you to map how all the pieces come together, align your team around it, keep it in sync with reality, and iterate.
We don’t claim to have all the answers. We’re working with product leaders to figure out, together, how to build a system for metrics-driven product development that can be utilized by companies who don’t have the resources of Amazon, Google, Netflix, and Facebook.
To get started with DoubleLoop, sign up on our homepage. We'll work with you to form a process for metrics-driven product development that's right for your company.
Thanks to Jeremy Toeman, Sumit Gupta, and John Cutler for providing feedback on previous drafts of this article.